

October 2023 Market Lookback
Estimated reading time: 0 minutes
October 2023 Market Lookback
The recent streak of strong overall US economic data was validated by the Q3 GDP release on October 26, which marked a significant acceleration from the prior quarterly pace of growth. Treasury yields reflected this, with longer-term yields in particular moving up in anticipation of the news. The S&P 500 declined for the third straight month, in the first such occurrence since March 2020. Against this market backdrop, geopolitical risk remained top of mind as the conflict between Israel and Hamas intensified.
Macro
•Q3 GDP grew at a seasonally adjusted annual rate of 4.9%, above consensus and a significant acceleration from the pace in recent quarters.
•336k jobs were added in September, while the prior two months saw net revisions of +119k.
•Job openings spiked to 9.6m in August, above consensus, and the prior month’s 8.9m.
•Retail sales grew 0.7% in September, while sales excluding autos and gas grew 0.6%, both significantly above consensus estimates of 0.3% and 0.1%, respectively.
•U.S. oil prices fell 10.8%, the first monthly decline since May.
•Gold prices rose 7.3%, the biggest increase since March.
Equities
•Bottom-up 2023 EPS estimates for the S&P 500 moved down to $220 in October from $221 previously, while top-down strategist estimates moved down to $219 from $220.
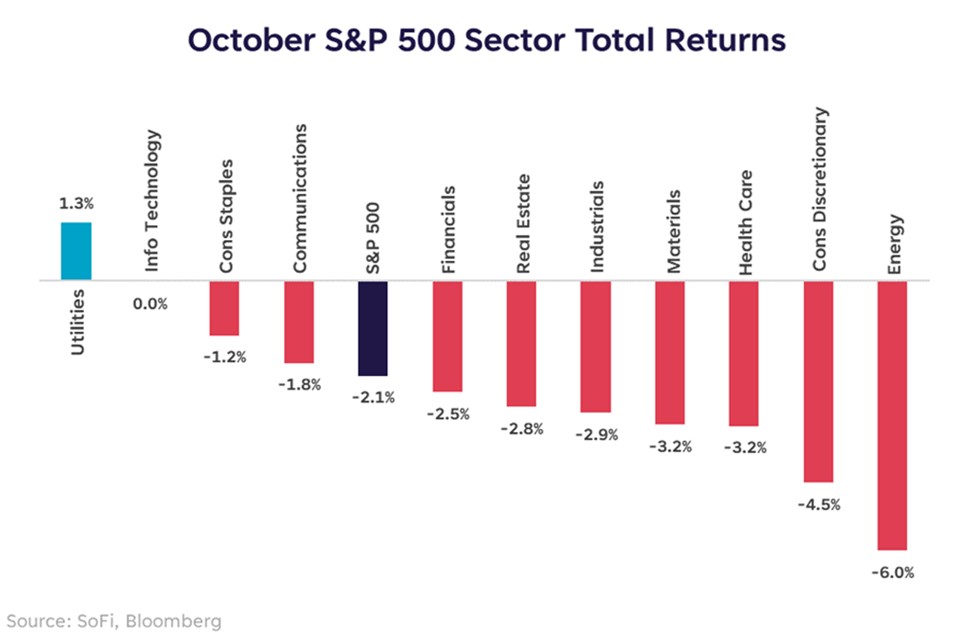
•The S&P 500’s total return of –2.1% was its third straight negative month, the longest string of negative monthly returns since March 2020.
•Large-cap stocks outperformed small-caps by 4.4 percentage points, the widest gap since March 2023.
•Utilities was the only sector with positive returns in October, its first month as the leading sector since December 2022.
Fixed Income
•The 2y10y Treasury yield curve steepened throughout the month, starting at -47bps, and ending at -16bps.
•Bolstered by a surging term premium (i.e. embedded compensation for interest rate uncertainty on longer-term maturities), the 10-year yield surpassed 5% on October 23 for the first time since July 2007.
•HY bond spreads increased to 457bps, their widest since July, while IG bond spreads rose to 169bps.
Mind the Black Swans
History is littered with shocks that come from out of nowhere and upend the prevailing narratives of the day. They are known as black swans due to their rarity, and inherent unpredictability. There are different types of black swans, such as natural disasters or geopolitical events. The pandemic was an obvious example in recent history, but geopolitical risk has been the story of late. Two major geopolitical events have occurred in the last 18 months: Russia’s invasion of Ukraine, and the sanctions that followed, and last month’s escalation of the Israel-Hamas conflict.
Beyond the humanitarian impact of these black swans, there are investment implications as well. The Russian invasion, and sanctioning, led to a spike in commodity prices that put a lot of pressure on the European economy, and drove inflation higher in many parts of the world. Some of these echoes can be felt in the recent Israel-Hamas conflict as well – gold and oil prices initially surged, though not quite to the same extent.
For investors, a worsening scenario would be if the Middle East conflict were to spread throughout the region, disrupting oil supply in the process, and reigniting inflationary forces. No one knows how things will play out, but unpredictability is an inherent characteristic of black swans.
Don’t Forget About Gray Rhinos
While black swans are inherently surprising and unpredictable, gray rhinos are things we anticipate but perhaps don’t fully appreciate. The Bank of Japan, as the last major central bank to maintain monetary easing, is one such gray rhino. While it’s unclear if, when, or how far, the BoJ might pivot, such a pivot could cascade through markets. That makes it important to understand. A pivot (away from yield curve control) would likely push Japanese real yields higher and narrow the real yield differential with the U.S. (i.e. Japanese yields may rise quickly while U.S. yields may not). Why does this matter? Real yield differentials are a meaningful driver of currency movements. For USD/JPY, 45% of the historical variation can be explained by the countries’ real 10Y yield differential. A narrower differential would be expected to boost the Yen versus the Dollar. Such a scenario would not be good for the popular Yen carry trade. An appreciating Yen could push some investors to unwind their trades, likely by selling other assets to cover their leverage in Yen. That demand for the Yen could then drive positive price momentum, and snowball into more investors trying to unwind their positions. Such a chain reaction occurred during the Great Recession, and while there were aggravating factors, the saying might still hold: Those who cannot remember the past (or their gray rhinos) are condemned to repeat it.
Disclaimer
SoFi Securities (Hong Kong) Limited and its affiliates (SoFi HK) may post or share information and materials from time to time. They should not be regarded as an offer, solicitation, invitation, investment advice, recommendation to buy, sell or otherwise deal with any investment instrument or product in any jurisdictions. Keep in mind that investing involves risk, and past performance of an asset never guarantees future results or returns. It’s important for investors to consider their specific financial needs, goals, and risk profile before making an investment decision.
SoFi HK does not make any warranties about the completeness, reliability and accuracy of this information and will not be liable for any losses and/or damages in connection with the use of this information.
The information and materials may contain hyperlinks to other websites, we are not responsible for the content of any linked sites. The information and analysis provided through hyperlinks to third party websites, while believed to be accurate, cannot be guaranteed by SoFi HK. These links are provided for informational purposes and should not be viewed as an endorsement. The risk involved in using such hyperlinks shall be borne by the visitor and subject to any Terms of Use applicable to such access and use.
Any product, logos, brands, and other trademarks or images featured are the property of their respective trademark holders. These trademark holders are not affiliated with SoFi HK or its Affiliates. These trademark holders do not sponsor or endorse SoFi HK or any of its articles.
Without prior written approval of SoFi HK, the information/materials shall not be amended, duplicated, photocopied, transmitted, circulated, distributed or published in any manner, or be used for commercial or public purposes.


About SoFi Hong Kong
SoFi – Invest. Simple.
SoFi Hong Kong is the All-in-One Super App with stock trading, robo advisor and social features. Trade over 15,000 US and Hong Kong stocks in our SoFi App now.