

Looks at: Expensive Markets
Estimated reading time: 6 minutes
Can You Take Us Higher?
Creed is a band we don’t know much about, but their song “Higher” is one that even the most distant Creed listener likely knows. Creed is also a popular fragrance brand, we don’t believe there’s any connection, but please correct us if we are wrong.
In any event, markets smell expensive to us, but not to everyone — and that creates a debate with two valid arguments.
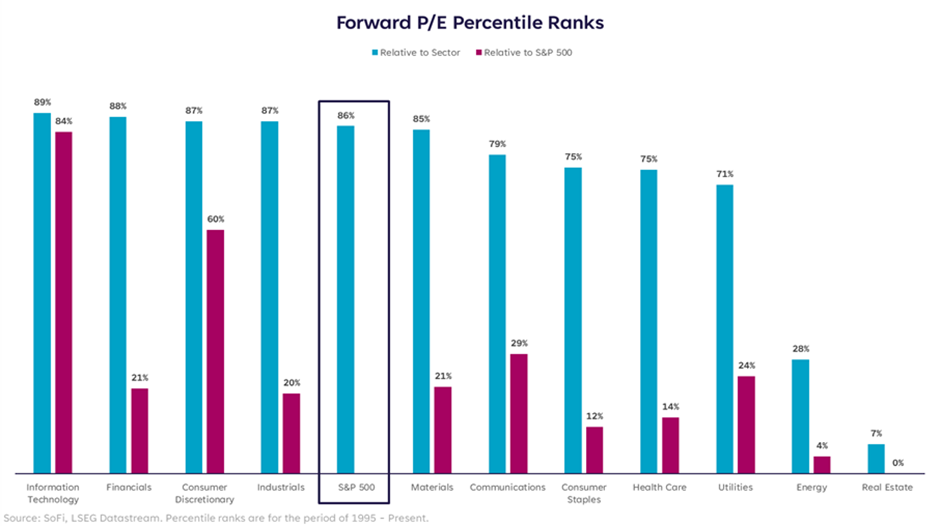
Let’s start with the most widely recognized measure of valuations, the forward price-to-earnings ratio (P/E). Rather than discuss it based on the actual levels, we’re looking at it here as a percentile rank relative to each sector’s history, and relative to the S&P 500 as a whole.
The most obvious takeaway from the chart below is that almost all of the blue bars are… high. The forward P/E on the S&P 500 is currently in the 86th percentile compared to historical levels. It’s easy to see why when we break it down by sector and find that five of the eleven sectors are at or above the 85th percentile compared to their own history, and four more are above the 70th percentile. That leaves only two sectors (Energy and Real Estate) that can be considered “cheap” relative to history, and those make up only about 5.5% of the index combined.
One could look at this and say, “none of them are over 90%, so there’s still room to run,” and that would also be accurate. In fact, there’s no limit to how far they can run, the 100th percentile is not a ceiling, anything beyond it would simply be a new record, which is a market headline we’ve heard over and over this year.
The conundrum as investors is this: When the market is this high relative to history, how do we decide whether to initiate or add to a position, knowing that it may be too expensive?
To a Place With Golden Streets
The answer to that question will always be subjective and depends on a number of important further questions, such as:
● How much are you willing to pay for future growth potential?
● How confident are you in the asset actually achieving that growth potential during your investment horizon?
● Are there other, more attractively priced assets that offer a similar opportunity?
If, as an investor, you can get comfortable with a high level of relative valuation and you feel confident the investment can produce the future growth potential you’re paying for today, that feels like what Creed would call a golden street. But of course, there are no guarantees, so risks to that expectation remain. And we’d argue, the higher the valuation, the higher the risk.
In an effort to answer the second and third questions above, we took a look at future earnings growth expectations by sector (navy blue) and compared it to where the sector currently ranks based on its price-to-earnings growth ratio (P/E/G or “peg” for short).
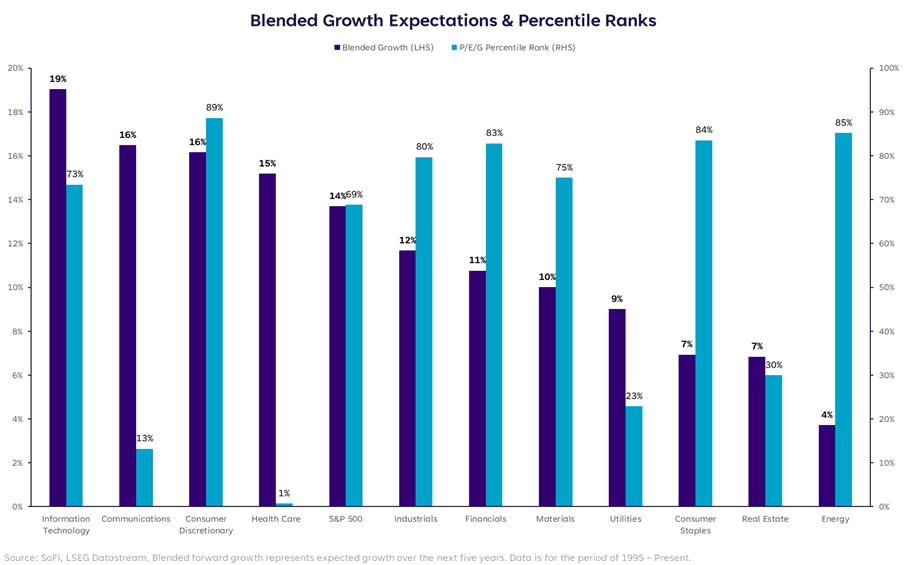
Some of the arguments we’ve heard on the other side of this debate are based on the takeaways from this chart. Specifically, when analyzing the current levels of technology and communications stocks, the absolute earnings growth rates are the highest in the index, and the P/E/G ratios (i.e., how much you’re paying for future growth) are only slightly elevated for tech in the 73rd percentile, but very low for Communications in the 13th.
The answer to the first question above seems less outrageous when we look at things this way. Hence, prices of those Magnificent 7 stocks and large-cap tech, or tech-adjacent, have remained elevated because investors can still justify higher prices based on the growth those stocks are expected to produce.
Come On, Let’s Go There
Back to the broad market though, and this week’s incoming inflation data. We’d be remiss not to look at valuations through a macro lens, and this is where we come up empty on the idea that markets are attractively valued.
We’ve been looking at forward P/Es so far, but those are based on variables that are at least somewhat uncertain because they’re projecting the future. In addition, we can look at trailing P/Es, based on variables that are certain and already in the past. There’s also a longer timeframe over which trailing P/Es are available, making it a more robust dataset.
When we split the environments up by CPI ranges and overlay historical trailing P/Es, a concerning picture emerges.
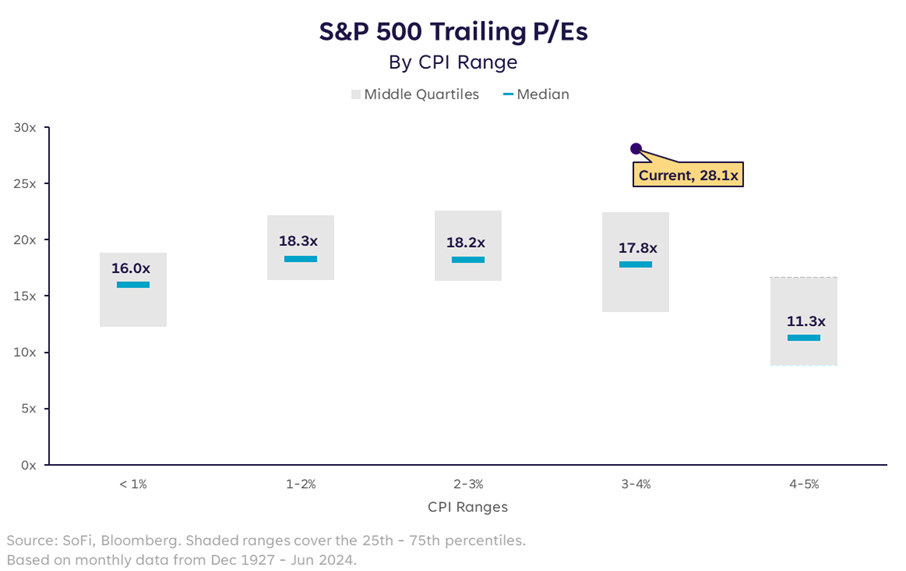
As of this writing, headline CPI sits at 3.3% y/y for May, with consensus expectations of 3.1% for June, which puts us squarely in that 3-4% range. With a median trailing P/E of 17.8x, the current level of 28.1x is far above average and even far above the top of this range.
If we assume that CPI will continue to fall, we can be encouraged by the fact that the median trailing P/E increases as CPI decreases, but not by much… and we’d still be well above it.
What does that mean? It doesn’t mean for certain that we’ll have a broad or painful pullback, but it does tell us that the risks of mean reversion, or at the very least, a redistribution of strength, could be on the horizon. Valuations are a bad timing mechanism in the short term, but over longer term periods they send important signals. Heed the warning.
Disclaimer
SoFi Securities (Hong Kong) Limited and its affiliates (SoFi HK) may post or share information and materials from time to time. They should not be regarded as an offer, solicitation, invitation, investment advice, recommendation to buy, sell or otherwise deal with any investment instrument or product in any jurisdictions. Keep in mind that investing involves risk, and past performance of an asset never guarantees future results or returns. It’s important for investors to consider their specific financial needs, goals, and risk profile before making an investment decision.
SoFi HK does not make any warranties about the completeness, reliability and accuracy of this information and will not be liable for any losses and/or damages in connection with the use of this information.
The information and materials may contain hyperlinks to other websites, we are not responsible for the content of any linked sites. The information and analysis provided through hyperlinks to third party websites, while believed to be accurate, cannot be guaranteed by SoFi HK. These links are provided for informational purposes and should not be viewed as an endorsement. The risk involved in using such hyperlinks shall be borne by the visitor and subject to any Terms of Use applicable to such access and use.
Any product, logos, brands, and other trademarks or images featured are the property of their respective trademark holders. These trademark holders are not affiliated with SoFi HK or its Affiliates. These trademark holders do not sponsor or endorse SoFi HK or any of its articles.
Without prior written approval of SoFi HK, the information/materials shall not be amended, duplicated, photocopied, transmitted, circulated, distributed or published in any manner, or be used for commercial or public purposes.


About SoFi Hong Kong
SoFi – Invest. Simple.
SoFi Hong Kong is the All-in-One Super App with stock trading, robo advisor and social features. Trade over 15,000 US and Hong Kong stocks in our SoFi App now.