

Decoding Markets: Separate Paths

Estimated reading time: 6 minutes
Bumpy Start
Last week, we wrote that the past few weeks had been a roller coaster. And it looks like we’re still on that ride. Since that April 10 column, the S&P 500 fell to as low as 5115 and as high as 5459, while the 10-year Treasury yield has moved around considerably, with an average intraday range of 15 basis points (i.e. 0.15%). Bumpy indeed.
Of course, this comes after a stretch of over two years of strong returns, so some might say that investors were “due” for a tougher year. Through April 16, the S&P 500 is down 10.3%, though it’s down a larger 14.1% from the all-time high of 6144 on February 19. Is the current drawdown enough of a flush to set markets up for a durable rebound? There’s no way of knowing for sure, but looking back at historical instances that resemble the current moment can give us a hint.
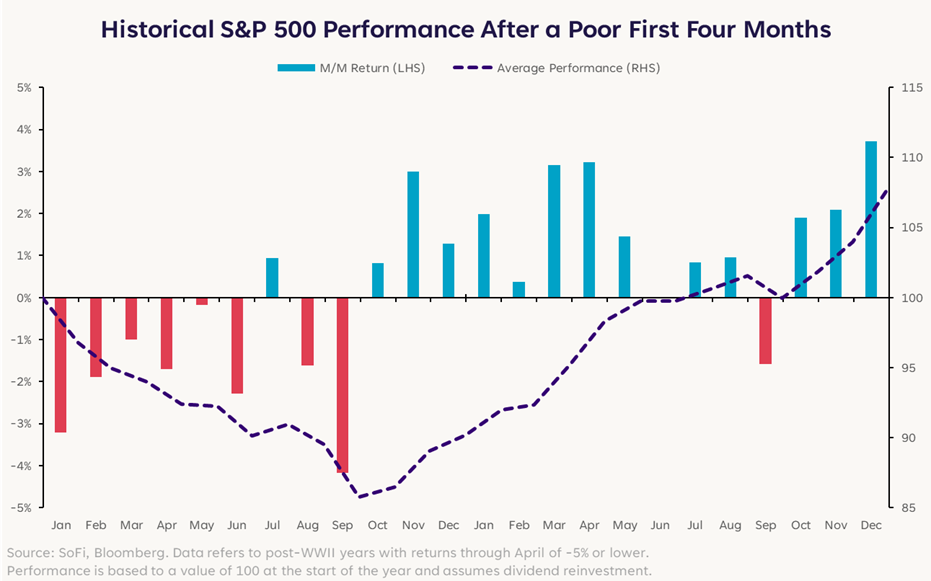
The chart above tracks the performance of stocks in the 13 post-WWII years where they were down 5% or more through April, and shows how they performed in the following months. Here are some key takeaways:
- In nine of the 13 years, returns were negative over the next six months, with an average return of -6.3%.
- Returns in the following calendar year have been strong, with an average return of +17.0%.
It goes without saying, but past performance is not indicative of future results. Just because markets usually went on to decline further doesn’t mean they’ll do so again. Instead, think of history as being helpful with contextualizing the market backdrop.
One year that bucked the historical trend was 2020. The market decline was swift at the start of the pandemic lockdowns, but stocks rallied strongly on the back of significant fiscal and monetary policy support. There’s a notable connection between then and now, as the current market upheaval has been tied to trade policy uncertainty. Perhaps now, like then, a rally will depend in large part on policy developments.
Relationship Breakup
While Treasury markets have been volatile overall, the magnitude of moves has been much more pronounced in longer-term maturities. For example, the 10-year yield fell to as low as 3.86% on April 4 and rose to as high as 4.59% on April 11. Usually, Treasury yields and the U.S. Dollar Index (DXY), which measures the value of the dollar against a basket of other major currencies, tend to move in the same direction. That’s because as yields rise, it often attracts investment from foreigners looking for higher returns on investment, strengthening the dollar and pushing the DXY higher.
However, there’s been a divergence in this pattern recently with the dollar weakening even though Treasury yields have risen. Since the end of February, the DXY is down 7.7%, while 10-year yields are 7 basis points higher.
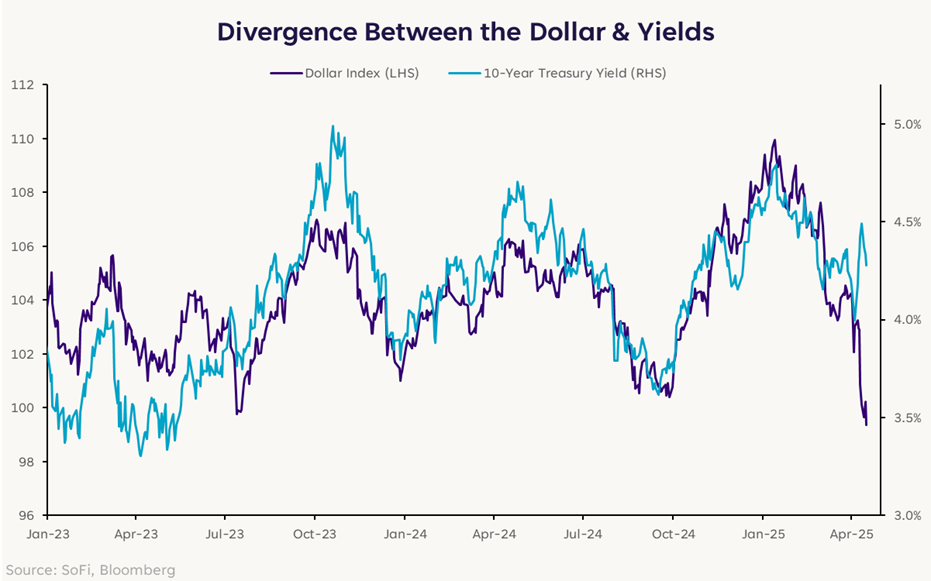
A possible explanation is that while higher yields should make a market more attractive, all else being equal, concerns about economic growth in the United States and broader geopolitical risks could be offsetting any boost from higher rates. This sort of two-month move, in conjunction with the sharp decline in stocks, is pretty rare, only happening three other times: February 1973, October 1978, and October 1990. Each of these episodes occurred against the backdrop of rising inflation concerns during periods of oil supply shocks and geopolitical instability.
It seems unlikely that a breakup in this relationship will last forever, but it’s an open question when and how the lines will get back together. Some sort of resolution to the policy uncertainty will probably be needed, but it could be a while before that happens.
No Respite from Inflation
Much of the talk around tariffs has been centered around the idea that they would disrupt global supply chains, weighing on economic growth and resulting in higher prices. Or in other words, stagflation. The fear of possible inflation shocks despite a weakening in the economy is a big reason why Federal Reserve officials have talked tough on inflation—contributing to investor concerns that the Fed may hold off on lowering interest rates. It was pretty surprising then that Treasury yields actually rose in the aftermath of the last two Consumer Price Index (CPI) reports, despite inflation coming in below consensus estimates. Lower inflation usually means the Fed has to do less to keep inflation at bay, which usually means lower interest rates.
The following scatterplot shows the move in the 10-year Treasury yield relative to CPI surprises since the start of 2022, with the recent CPI report a notable outlier.
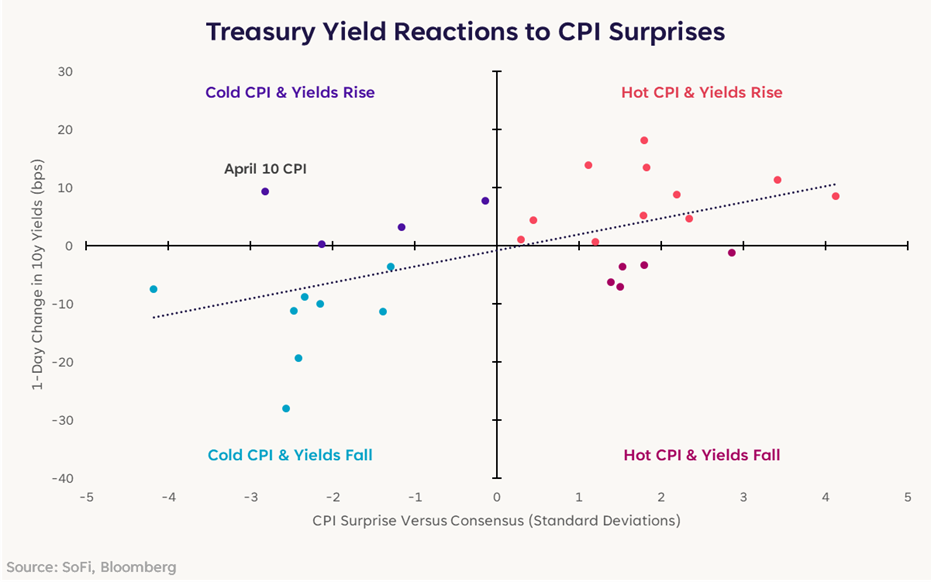
Relative to expectations, m/m CPI came in nearly three standard deviations below consensus. Based on 2022-24 statistics, 10-year yields should have declined by 10 basis points, but instead they increased by 9 basis points. Part of this is because while the CPI report had only just come out, in many ways investors considered it already stale due to the tariff developments in April. That speaks to how rapidly the macro backdrop has shifted.
The market environment in the first four months of 2025 has presented a complex picture. Poor initial returns, a decoupling of the dollar and Treasury yields, and an unusual reaction in the bond market to inflation data all reinforce how uncertain things are. However, we’re nearing the point now where new data could provide some sorely needed clarity, potentially setting up investors for clearer skies later in the year—and into the next.
Disclaimer
SoFi Securities (Hong Kong) Limited and its affiliates (SoFi HK) may post or share information and materials from time to time. They should not be regarded as an offer, solicitation, invitation, investment advice, recommendation to buy, sell or otherwise deal with any investment instrument or product in any jurisdictions. Keep in mind that investing involves risk, and past performance of an asset never guarantees future results or returns. It’s important for investors to consider their specific financial needs, goals, and risk profile before making an investment decision.
SoFi HK does not make any warranties about the completeness, reliability and accuracy of this information and will not be liable for any losses and/or damages in connection with the use of this information.
The information and materials may contain hyperlinks to other websites, we are not responsible for the content of any linked sites. The information and analysis provided through hyperlinks to third party websites, while believed to be accurate, cannot be guaranteed by SoFi HK. These links are provided for informational purposes and should not be viewed as an endorsement. The risk involved in using such hyperlinks shall be borne by the visitor and subject to any Terms of Use applicable to such access and use.
Any product, logos, brands, and other trademarks or images featured are the property of their respective trademark holders. These trademark holders are not affiliated with SoFi HK or its Affiliates. These trademark holders do not sponsor or endorse SoFi HK or any of its articles.
Without prior written approval of SoFi HK, the information/materials shall not be amended, duplicated, photocopied, transmitted, circulated, distributed or published in any manner, or be used for commercial or public purposes.


About SoFi Hong Kong
SoFi – Invest. Simple.
SoFi Hong Kong is the All-in-One Super App with stock trading, robo advisor and social features. Trade over 15,000 US and Hong Kong stocks in our SoFi App now.