

Weighs in on what we can expect for the second half of 2024.
Estimated reading time: 12 minutes
Aging Gracefully
The mid-year outlook is always an interesting combination of a report card and a progress report. It’s a time to review our annual outlook and see what has materialized as expected and what hasn’t. It’s also a time to check in on year-to-date market activity, economic developments, and to recalibrate an outlook for the second half of the year.
Our 2024 outlook was titled “A Cycle for the Ages” and still feels very appropriate. One thing that has gone as expected in the first half of 2024 is that we’ve seen more surprises, including the sheer amount of new records we’ve set in markets and economic variables. This is undoubtedly still a cycle for the ages – and one that, so far, is aging gracefully.
Of Jumbo Proportions
If we had to pick one word to characterize 2024 thus far it would be ‘big.’ We are not just talking about stock market performance, although an S&P 500 up 14% and semiconductors up 50% through early June is quite strong. We are talking about the unexpected and large moves we’ve seen in Fed rate expectations, Treasury yields, and commodity performance. And that list doesn’t even include the various new records we’ve already set this year, but more on that in the next section.
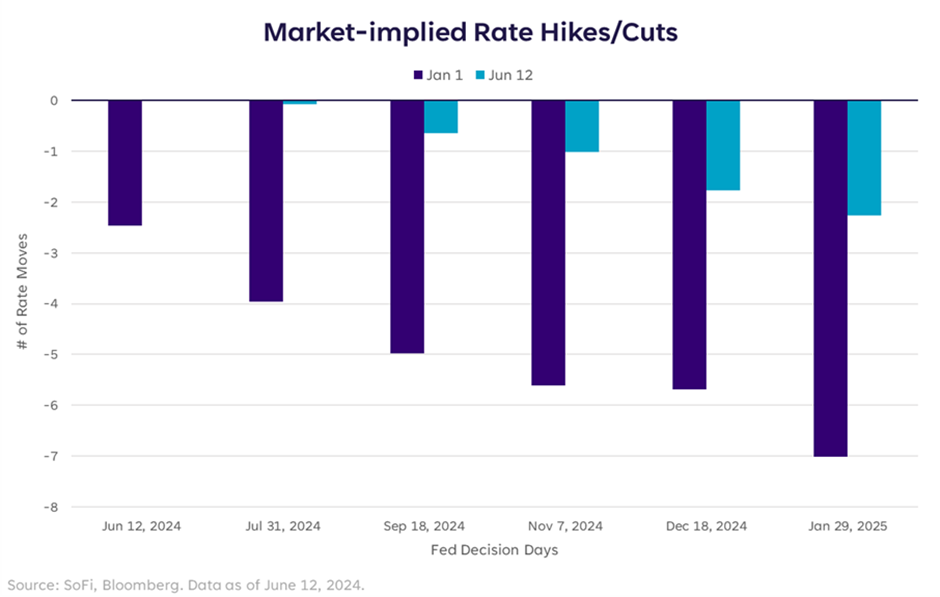
Perhaps the biggest move was in Fed rate expectations. Markets came into the year expecting six cuts in 2024 starting in March — as it stands now, futures pricing suggest one or two before the end of the year. Not only was this a large and quick repricing, but it resulted in surprisingly unbothered equity markets that, before this change, were seemingly begging for cuts.
A combination of strong economic data, sticky inflation readings, and hawkish Fed speak brought cut expectations down, and caused big moves in Treasury yields. The 10-year Treasury yield started the year at 3.88% and rose to a high of 4.70% on April 25 as investors tried to digest a much longer Fed pause than previously thought.
Despite a brief 5% correction in April, equity markets have continued upward. All of this has caused most, if not all, bears to turn at least slightly bullish in the short-term, and led many Wall Street strategists to raise their year-end price targets. The chase is on.

The other big set of moves we want to highlight is the performance of certain commodities YTD. Although headlines are still dominated by AI and related stock performance, a smattering of commodities have seen eye-popping returns in 2024 that most investors were likely not positioned for. New year, new surprises.
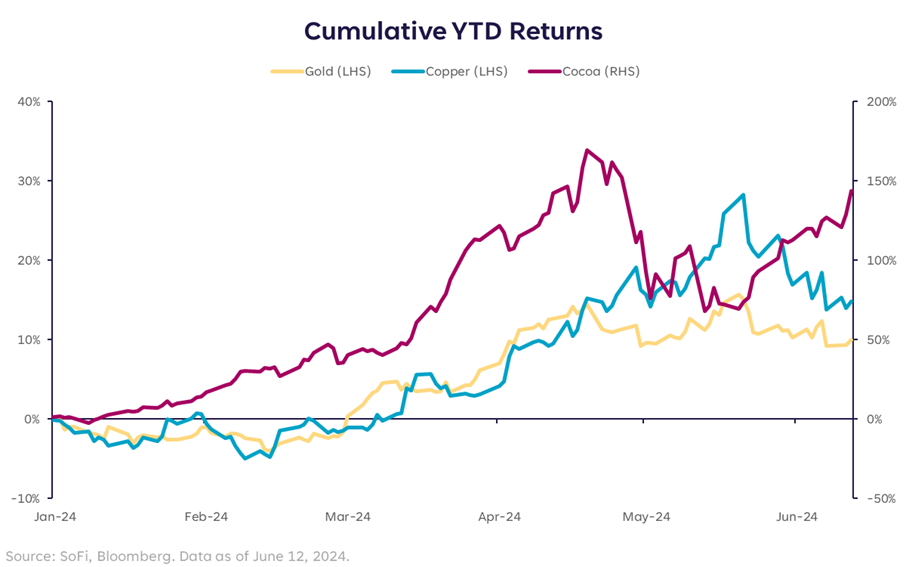
The drivers of these moves were all different, which is perhaps the most interesting takeaway. The move in gold was more of a defensive/global currency volatility play, while copper prices were a result of supply shortages and the expectation that AI-driven data center build outs would keep demand elevated.
In any event, these pockets of parabolic charts were surprising and an indication that inflationary forces are not dead.
Broken Records
To put a cherry on top of the big market moves sundae, the first half of the year also saw a number of new records, a statement that’s starting to sound like a broken record.
The S&P 500, Dow Jones Industrial Average, Nasdaq Composite, and Nasdaq 100 hit new all-time highs. Much of the recent run in the S&P and Nasdaq has been driven by semiconductor and AI enthusiasm, which is seemingly served in endless quantities. That enthusiasm has even lifted adjacent-story assets such as copper (above), and utilities which are needed to power the new data centers.
This AI frenzy of buying has pushed markets toward a couple other records. Namely, the number of trading days we’ve now gone without a 2% decline in the S&P. This is the longest stretch since February 2018. It’s not a new historical record, but it stands out as one of the longest in history — though still a far cry from the 949 day stretch that ended in February 2007.
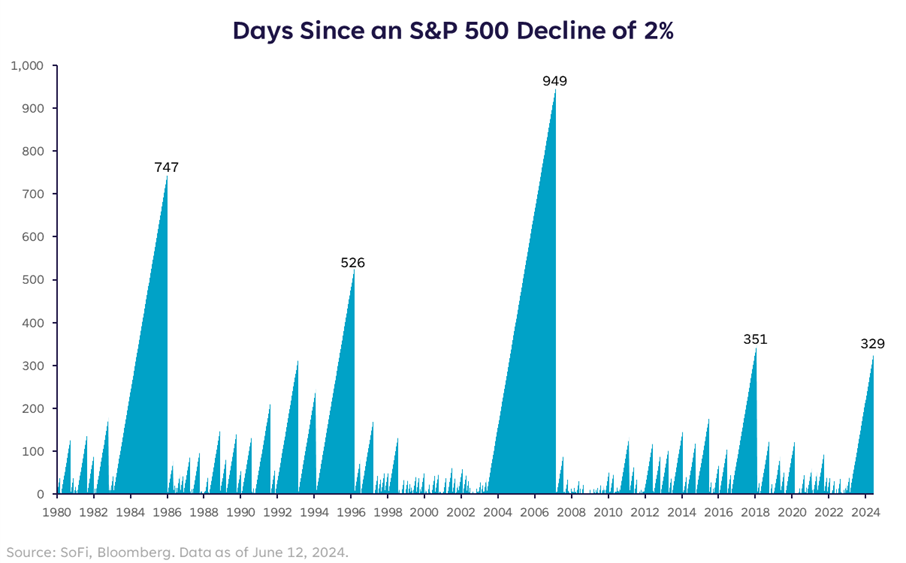
It’s easy to see why bullish sentiment has taken over and fewer bears remain. Everything appears to be going well and risk appetite looks healthy.
But some concerning records have also been broken. In February, we crossed the threshold into the longest yield curve inversion of all time. That fact in-and-of-itself doesn’t foretell a particular outcome, but at some point the inversion has to re-steepen and become an upward sloping curve. The reason this matters is because an inverted curve is typically seen as a precursor to a recession, and some believe the longer and deeper the inversion, the more painful the result on the other side.
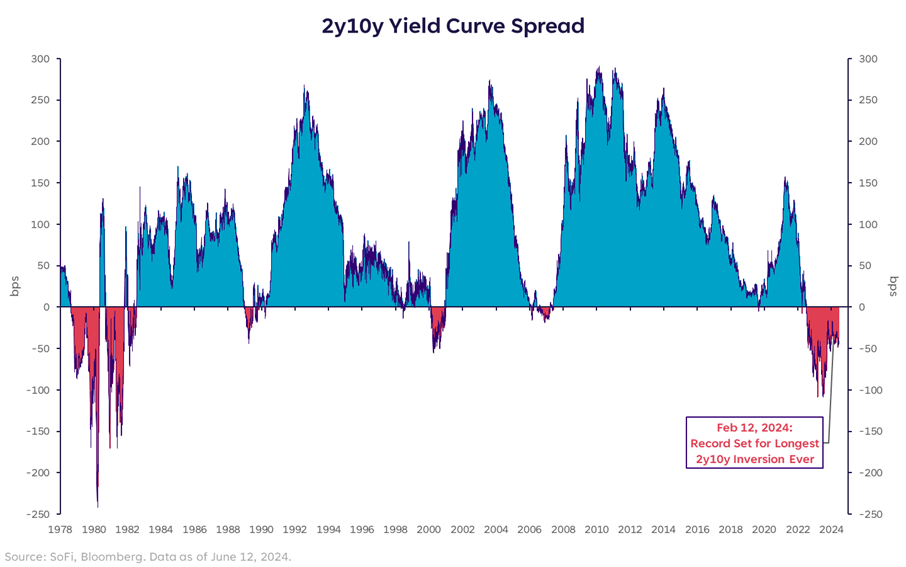
The expected painful result hasn’t happened yet, but neither has the re-steepening. History has shown us that equity markets tend to do well during yield curve inversions, but struggle as a re-steepening occurs, which we’ll cover later in this piece.
But wait, there’s more. We’re also nearing the longest Fed pause ever, and if rates stay on hold past October, we’ll break that record, too. The consensus school of thought seems to be that Fed cuts will be supportive of equities – but since cuts are very likely to cause a curve steepening, we are not so confident that will be the case.

Again, this alone does not signal anything of certainty, but in prior cycles it hasn’t been the hikes or the pauses that the market struggles with, it has been the cuts. Market bottoms typically occur after the cuts begin, because they typically occur in response to a weakening environment. In fact, only one time in history did a cutting cycle (albeit a gentle cutting cycle) occur without a subsequent market bottom. That period was in the mid-90s, and some believe we may be able to repeat the same scenario this time.
One of the big differences between then and now was that the unemployment rate was at 5.6% and on its way down when the Fed cut rates in July of 1995. We’d call that uncomfortably high, but not alarmingly high. As such, a little stimulation and loosening in conditions may have been warranted.
On the contrary, we only just ended a streak of sub-4% unemployment in May, which had gone on for 28 consecutive months. The labor market has been tight for a long time, and the focus is slowly shifting to labor as the next most important gauge of when the Fed will start cutting. But here’s the rub: If the Fed won’t start cutting until labor weakens further, they’ll be cutting into a rising unemployment picture. That would be consistent with a weakening environment during cuts, rather than a strengthening environment like we saw in the 90s. Thus, consistent with expectations of market turbulence rather than market exuberance.
Thirsty for Something Cold
Despite these historical truths, markets have welcomed cooling data. And despite various Fed speakers continuing to warn that rates will be higher for longer, or that further hikes are not entirely off the table, any indication from economic data that puts a tally in the cooling column has been rewarded.

So far, that’s been a safe stance to take. Indicators for inflation, jobs, and GDP have come down off of hot levels, but none have approached nor entered concerning territory. That would be the most likely definition of a soft landing if it can persist as monetary policy normalizes.
But when does cooler data become too cool? And if the data is cooling, doesn’t that mean we’re late in the economic cycle?
Growth data has already started to cool and is expected to remain around or below trend (trend being 1.8% according to the FOMC) for the remainder of the year. We view this as a welcome sign in the fight against inflation, but an unwelcome sign for those betting on ever-expanding profit margins and revenue growth; especially because the consumption component is what seems to be taking a hit.

As for the question that seems to be at the crux of everything – where are we in the business cycle – We still firmly believe that lower GDP, cooling labor markets, falling inflation, large-cap stock dominance, and a Fed that’s about to start cutting rates, are clear indications of a late cycle environment. We’ve said it before and we’ll say it again, just because it’s longer than expected, doesn’t mean it’s over. But it may not end in the second half of 2024 either.
The Other Side of June
As we begin the second half of 2024, we expect more records to be broken that will solidify this cycle as one for the ages. We also expect the debate over whether or not we’ve already achieved a soft landing to continue, and for pockets of the market to become more extended than they already are because investors have proven that it takes more than a wobble to threaten their optimism.
But the path matters. We do not expect market strength to broaden out anew, and we do not expect economic data to surprise to the upside any longer. Here are some specific variables to watch:
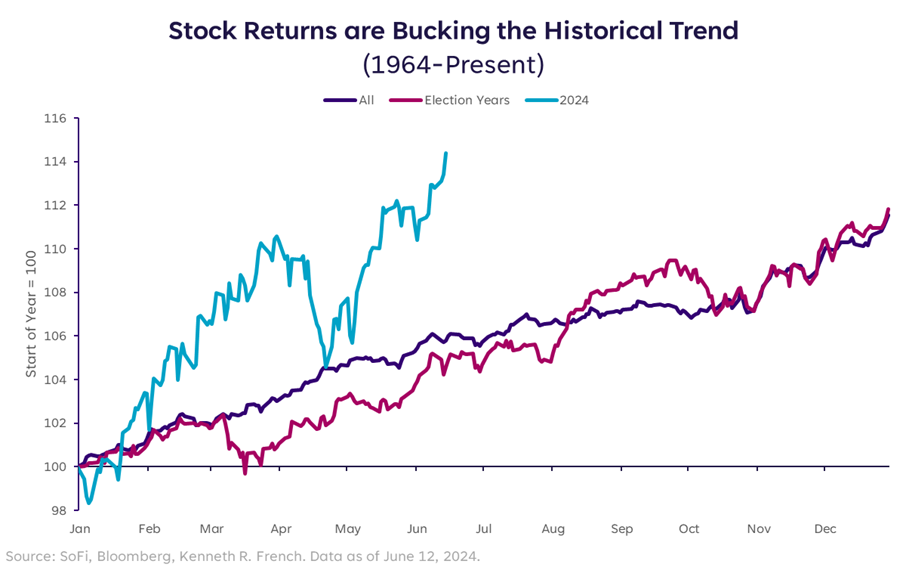
The U.S. Presidential Election. This goes without saying. There are seasonal patterns to how markets typically behave during election years and so far, we’re off track. Given the uncharacteristically positive returns we’ve had already this year, we’d expect some volatility through summer as debates begin, uncertainty mounts, and economic data cools. But we also expect that post-election relief will be in order, as usual. During that possibly volatile pre-election period, the severity of a market decline will matter. We expect political narratives to center more around economic weakness if a pullback of 10% or more materializes, but for the relief on the other side to be stronger.
The unemployment rate rising above 4%. As attention shifts more and more to the labor market, investors will be watching payrolls data and the unemployment rate. Given that we only just emerged from sub-4% unemployment, we don’t think markets are prepared for a rate between 4-4.5%, which is where we believe we will finish the year (the FOMC forecast is for 4.0% unemployment, we expect it to be higher). It’s important to note that even 4.5% is not high, but under 4% is abnormally low. Investors have grown accustomed to a tight labor market as a buoy; therefore, the digestion of rising unemployment could bring jitters.
Yield curve steepening. Last, but certainly not least on this list. We’ve seemingly forgotten about the yield curve inversion, or perhaps started to think it doesn’t matter. We believe it does matter, and the lack of concern over it is a form of complacency. As the first Fed rate cut nears, short-term rates are likely to fall, which could reduce the inversion, if not erase it entirely. The chart below shows average stock and bond performance during yield curve inversions – and compares the periods when the curve is re-steepening to all other inversion scenarios. During re-steepenings, stock performance is negative on average and the possibility of a steep decline is higher. The threat of a steepening curve is real in the second half and investors should take notice.

So which parts of the market look poised to do well? The answer to this is purely my opinion, and is based on my belief that we are late-cycle, headed toward rate cuts, a steepening yield curve, and a period of a weaker U.S. dollar. And remember, the path matters.
That’s a Wrap
Another couple quarters have come and gone, and one thing’s for sure: Markets can be a most humbling, rewarding, and exhilarating sport. We’ve never been a professional athlete, but we imagine the dedication and mental toughness it takes to consistently put yourself in a position to win or lose, sometimes through no control of your own, is unparalleled. Except, perhaps, by market participants trying to choose the right spots to make money every year. We continue to take our chances, using the best information we have, and walk out onto the field. Here’s to another six months worthy of prime-time viewership.
Disclaimer
SoFi Securities (Hong Kong) Limited and its affiliates (SoFi HK) may post or share information and materials from time to time. They should not be regarded as an offer, solicitation, invitation, investment advice, recommendation to buy, sell or otherwise deal with any investment instrument or product in any jurisdictions. Keep in mind that investing involves risk, and past performance of an asset never guarantees future results or returns. It’s important for investors to consider their specific financial needs, goals, and risk profile before making an investment decision.
SoFi HK does not make any warranties about the completeness, reliability and accuracy of this information and will not be liable for any losses and/or damages in connection with the use of this information.
The information and materials may contain hyperlinks to other websites, we are not responsible for the content of any linked sites. The information and analysis provided through hyperlinks to third party websites, while believed to be accurate, cannot be guaranteed by SoFi HK. These links are provided for informational purposes and should not be viewed as an endorsement. The risk involved in using such hyperlinks shall be borne by the visitor and subject to any Terms of Use applicable to such access and use.
Any product, logos, brands, and other trademarks or images featured are the property of their respective trademark holders. These trademark holders are not affiliated with SoFi HK or its Affiliates. These trademark holders do not sponsor or endorse SoFi HK or any of its articles.
Without prior written approval of SoFi HK, the information/materials shall not be amended, duplicated, photocopied, transmitted, circulated, distributed or published in any manner, or be used for commercial or public purposes.


About SoFi Hong Kong
SoFi – Invest. Simple.
SoFi Hong Kong is the All-in-One Super App with stock trading, robo advisor and social features. Trade over 15,000 US and Hong Kong stocks in our SoFi App now.